Overview
This project focuses on analyzing Airbnb listings in Lisbon using both SQL and Tableau. The dataset includes information on listings, calendar availability, and reviews. The goal is to gain insights into pricing trends, property types, and neighborhood preferences of Airbnb guests in Lisbon.
Links to the project: 👉

Picture of Aayush Gupta in Unsplash
Dataset
The dataset consists of three main tables:
- Listings: Contains detailed information about Airbnb listings, including property type, location, host details, and pricing.
- Calendar: Provides information on the availability and pricing of Airbnb listings for specific dates.
- Reviews: Contains reviews from guests who have stayed at Airbnb listings, including ratings and comments.
Data Processing
- Download and Import: The dataset was obtained from Airbnb and imported into SQL Server using batch processing techniques. netnerds.net
- Cleaning: SQL was used to clean and preprocess the data, ensuring consistency and accuracy across the three datasets.
- Enrichment: Additional data on Lisbon neighborhoods’ zip codes was incorporated from an external dataset to enable geographical analysis in Tableau. www.listendata.com
Final Dataset
The cleansed and processed dataset includes the following fields:
- Listing URL
- Host Information
- Neighbourhood Details
- Property Type
- Room Type
- Bedrooms and Beds
- Instant Bookable
- Listing ID and Host ID
- Host Since
- Host Location
- Host Response Rate and Acceptance Rate
- Location Coordinates (Longitude and Latitude)
- Accommodation Details
- Bathrooms
- Minimum and Maximum Nights
- Number of Reviews
- Review Scores
- Last Review Date
- Price
- Zipcode
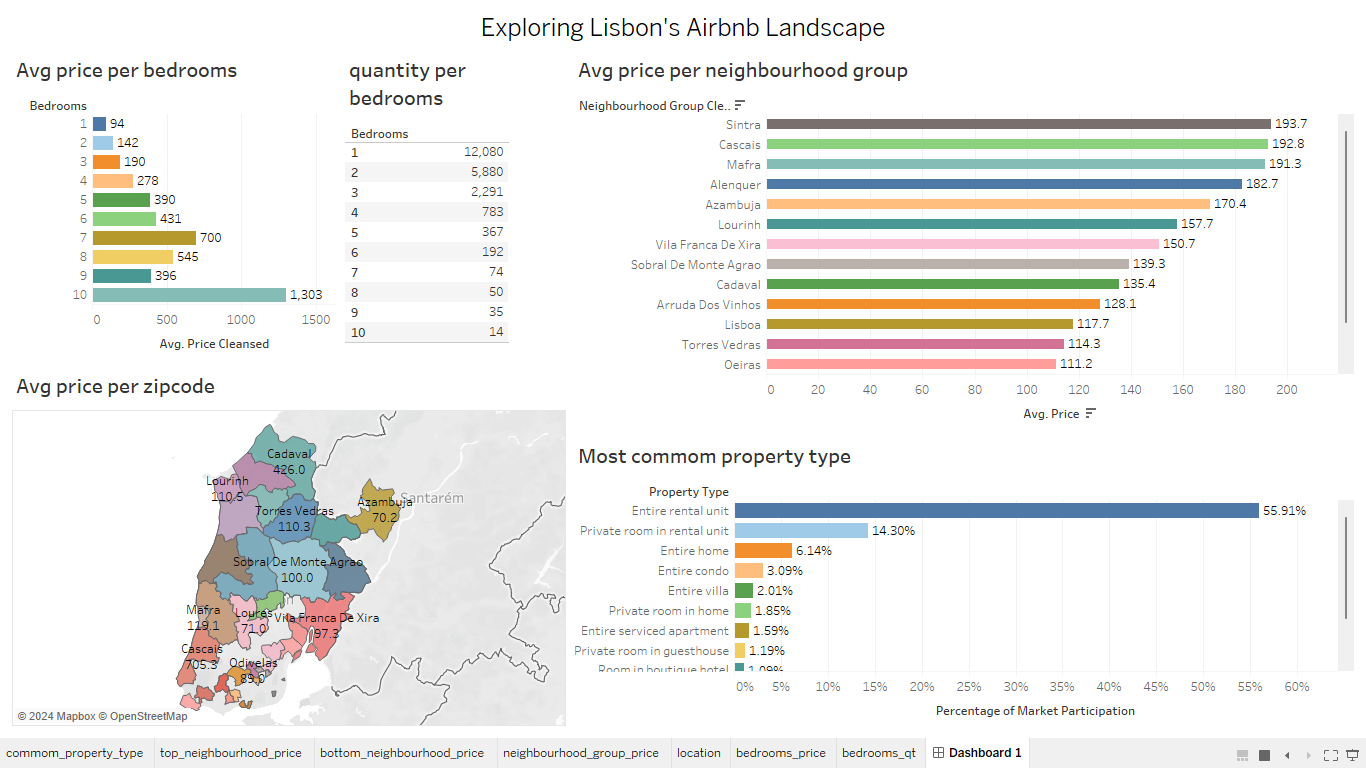
Charts Created
- Average Price per Bedrooms: Visualizes the average price of Airbnb listings based on the number of bedrooms.
- Average Price per Zipcode and Map: Displays the average price of Airbnb listings per zipcode, accompanied by a geographical map for spatial analysis.
- Average Price per Neighbourhood Group: Shows the average price of Airbnb listings categorized by neighborhood groups in Lisbon.
- Most Common Property Type: Highlights the most common property types among Airbnb listings in Lisbon.
Dashboard
A dashboard was created in Tableau to present all the charts in a cohesive and interactive manner, allowing users to explore and analyze Airbnb listing data efficiently.
Key Findings
- Pricing Trends: The analysis reveals variations in pricing based on factors such as bedrooms, zip codes, and neighborhood groups.
- Property Types: Insights into the most common property types provide valuable information for potential Airbnb hosts and guests.
- Geographical Analysis: The geographical map visualization helps identify areas with higher or lower average prices, aiding in decision-making for both hosts and guests.
Conclusion
The Airbnb Lisbon Dashboard provides valuable insights into pricing trends, property types, and neighborhood preferences in the Lisbon area. By leveraging SQL for data processing and Tableau for visualization, this project offers a comprehensive analysis of Airbnb listings, enabling stakeholders to make informed decisions.
Dashboard Airbnb listing in Lisbon
Colophon
thanks Alex for his tutorials and explanations (Alex The Analyst)