Overview
This project focuses on analyzing bike sales data using Excel. The dataset contains information on customers, including demographic details such as gender, income, education, occupation, and commute distance, along with whether they purchased a bike or not.
Link to the project 👉 Bike Sales Dashboard Project

Picture of Jannis Lucas in Unsplash
Dataset
The raw dataset includes the following columns:
- ID
- Marital Status
- Gender
- Income
- Children
- Education
- Occupation
- Home Owner
- Cars
- Commute Distance
- Region
- Age
- Purchased Bike
After cleaning the dataset, irrelevant columns were removed, and adjustments were made to enhance readability and analysis.
Cleaning Process
Column Selection: Only relevant columns were retained for analysis, including Gender, Income, Children, Education, Occupation, Home Owner, Cars, Commute Distance, Region, Age, Age Brackets, and Purchased Bike.
Data Transformation: Income values were standardized, removing special characters and converting them to numerical values. Age brackets were introduced to categorize customers into age groups.
Dashboard Creation
The main analysis was conducted through pivot tables to visualize key insights. The dashboard includes the following pivot tables:
- Average Income by Gender and Bike Purchase Status: This table provides insights into the average income of customers based on gender and whether they purchased a bike or not.
- Count of Purchased Bike by Commute Distance: This table presents the count of bike purchases categorized by commute distance.
- Count of Purchased Bike by Age Brackets: This table displays the count of bike purchases categorized by age brackets.
Key Findings
- Income Analysis: On average, male customers have a slightly higher income compared to female customers. Customers who purchased a bike tend to have slightly higher incomes overall.
- Commute Distance: Most bike purchases occur for customers with commute distances between 0-1 miles and 5-10 miles.
- Age Distribution: Middle-aged customers (between 40 and 60 years old) constitute the largest segment of bike purchasers.
Conclusion
The dashboard provides valuable insights into bike sales trends based on customer demographics. Further analysis and exploration can be conducted to uncover additional patterns and optimize marketing strategies.
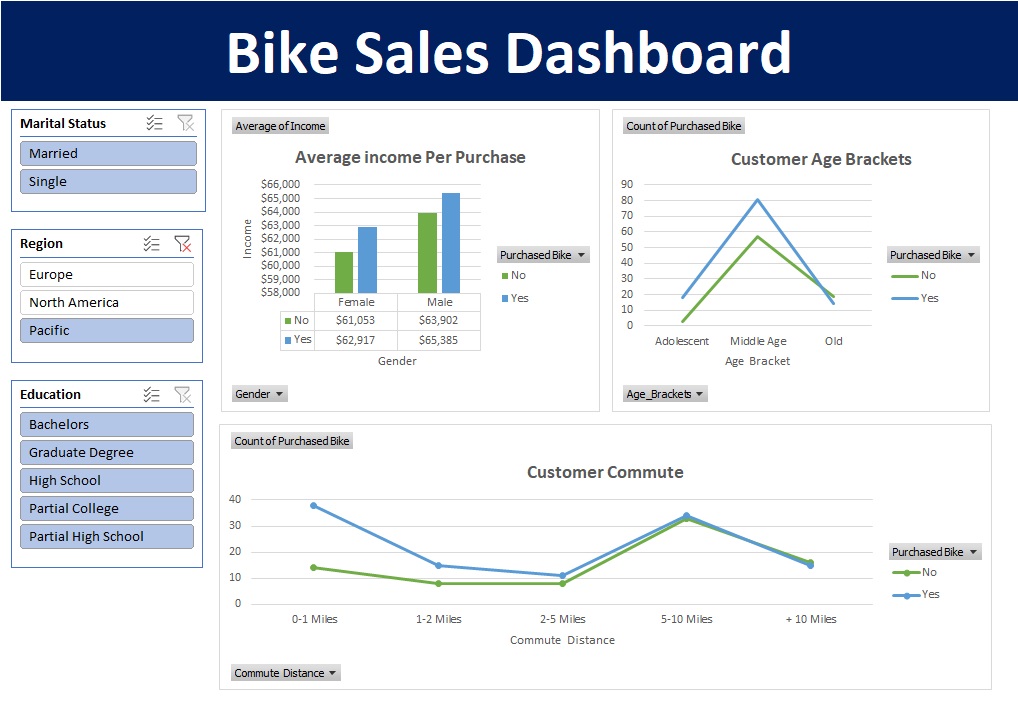
Dashboard bikes sales
Colophon
thanks Alex for his tutorials and explanations (Alex The Analyst)